
Using Ripple Effects Mapping to Determine Your Program Outcomes
 Webinar Powerpoint Presentation.Hansen and Higgins.pdf
About the presenters: Debra Hansen, Extension Associate Professor, Washington State University Extension and Lorie Higgins, Extension Specialist, University of Idaho Extension.
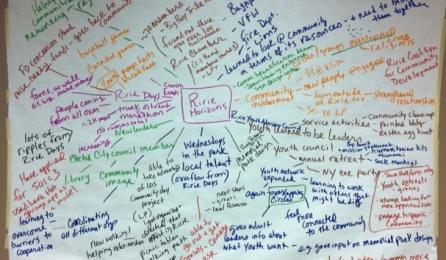
Description: Identifying the impacts of community development work is often challenging due to the time lag between knowledge gained, behaviors undertaken and impacts realized. Pre-post evaluations and follow-up surveys aren’t guaranteed to elicit all the indirect “ripple effects” of a program. Someone who takes a leadership course might credit the knowledge and confidence gained with starting a community garden, but not the spin-offs resulting from the garden or work with partners. This webinar will share how to facilitate the Ripple Effects Mapping (REM) technique starting with a focus group setting where storytelling initiates the process. Groups build on these stories while the facilitator maps the accomplishments, partnerships, unique contributions and gaps in delivery identified by participants. By visualizing all the things that happened as a result of a program, the process can show communities, program leaders and funders how their work interacts with the community system. We will describe how the mapping process has been used in a number of states and settings as well as how the maps have been digitized and data coded to the Community Capitals Framework.
Ripple Effects Mapping Resources
Articles:
Ripple Effects Mapping: An Effective Tool for Identifying Community Development Program Impacts
Ripple Effects Mapping: A “Radiant” Way to Capture Program Impacts
Tools:
Washington State University Extension, Stevens County’s Ripple Effects Mapping Tools Website